12 Month Dynamic Chart
Free
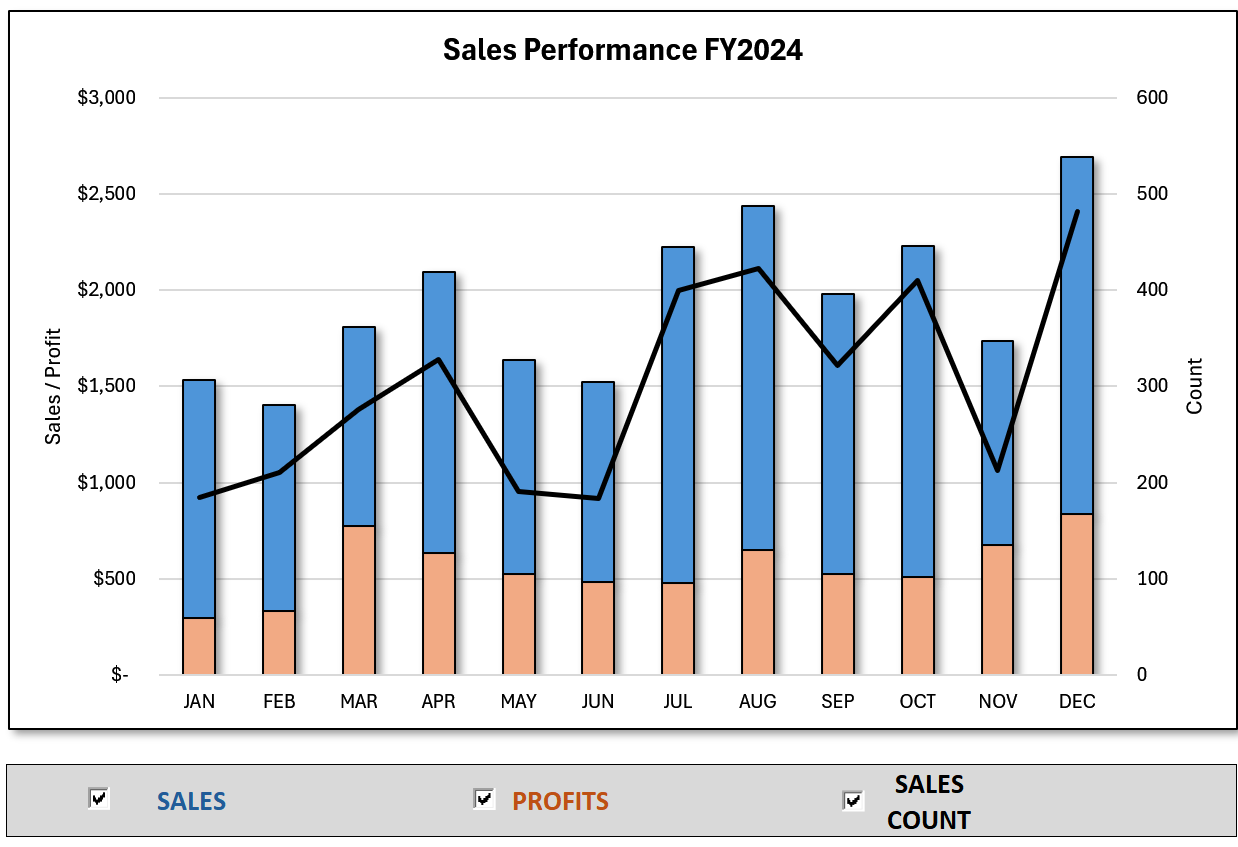
The 12-month dynamic chart offers a user-friendly interface that allows you to customize your data visualization experience effortlessly. With intuitive checkbox selections, users can choose which data sets to display or hide, creating a tailored view that suits their individual needs. This flexibility enables a focused analysis of specific time frames or categories, making it easier to track trends and insights over the year. Whether you're monitoring sales performance, customer engagement, or any other key metrics, this dynamic chart adapts to your preferences. Its customizable features ensure that you can highlight the most relevant information while eliminating clutter, empowering decision-making with clarity and precision. This tool is essential for anyone looking to enhance their data reporting and presentation capabilities over a 12-month span.